In this guide
You want to know which city dropped last month, whether online orders are growing faster than store sales, and which customers bought more than three times. The answers are sitting in your billing system, but getting them means waiting for whoever knows the spreadsheet, or learning a reporting tool you will never have time for. Natural language analytics for small business data promises a shortcut: type the question in plain English and get a chart and a sentence. This guide explains how that really works, where it goes wrong, and how to judge any tool that claims it, using a simulated demo you can click through.
How do small businesses get answers from their data today?
Most owners get numbers in one of three ways: a report that someone built months ago, a spreadsheet exported by hand, or a quick question to the one person who understands the data. Each has a cost.
- Fixed reports answer yesterday's questions. A new question needs a new report, so it waits.
- Manual exports go stale. By the time a pivot table is finished, the data has moved.
- One person becomes a bottleneck. If they are away, nobody knows how revenue or margin was worked out.
- The same word means different things. "Sales" may include tax in one sheet and exclude returns in another.
The real problem is rarely drawing a chart. It is agreeing on definitions and making answers repeatable.
How does "ask in plain English" work behind the scenes?
A question typed in plain English is converted, in several steps, into a structured query that a database can run. Understanding the steps helps you spot where mistakes can enter.
- Find the measure. What is being counted or summed: revenue, orders, profit, return rate?
- Find the breakdown. By what: city, channel, product, month, weekday?
- Find the filters. Only one city, only online, excluding a product?
- Resolve the time. Phrases such as "last quarter" or "since June" are turned into exact dates, relative to the date the data runs to.
- Build and run the query. Filter, group, add up, sort, take the top few.
- Choose how to show it. A trend over time suits a line, parts of a whole suit a bar or donut, and a single number suits a big figure with a comparison.
- Write the sentence. A plain statement of what the numbers say, with the query kept visible.
Some tools do steps 1 to 4 with a language model, others with rules and a vocabulary built from the data. Both approaches can misread a question. The difference between a trustworthy tool and a risky one is whether it shows you how it read the question.
Why should you always see the query behind the answer?
If a tool answers "revenue by city" with a clean chart, you have no way to know whether it summed gross sales or net sales, included returns, or filtered a date range you did not ask for. Showing the generated query, in code or in a plain "how I answered this" explanation, turns a black box into something you can check. A good habit: for any number you will act on, read the measure, the filters and the date range the tool used, in one line, before you trust it.
Tip
Pick three questions whose answers you already know from your own books. Ask them in plain English. If the tool is wrong on a question you can verify, assume it can also be wrong on one you cannot.
What is a worked example of a good answer?
Take the question "revenue by channel last quarter". Using made-up figures in lakh, suppose the result is:
| Channel (made-up) | Revenue, last quarter | Share of total |
|---|---|---|
| Online | 12 | 30% |
| Own stores | 18 | 45% |
| Marketplace | 6 | 15% |
| Wholesale | 4 | 10% |
| Total | 40 | 100% |
The shares are each channel divided by 40: 12 / 40 = 30%, 18 / 40 = 45%, 6 / 40 = 15% and 4 / 40 = 10%. Now ask "compared with the previous quarter". If the previous quarter was 32, growth is (40 minus 32) divided by 32, which is 8 / 32 = 25%. A useful follow-up is "what changed": a driver breakdown shows how that +8 splits across channels, for instance online +3, stores +4, marketplace +2 and wholesale -1, which adds up to +8 exactly. A good tool makes parts add up to the whole, because a breakdown that does not add up is a warning sign.
What can natural language analytics not do?
Being clear about limits is where honest tools stand apart.
It cannot answer questions your data does not contain
Weather, competitors' prices, staff data or web traffic cannot be answered from a sales database. A good tool says so and suggests what it can answer, rather than inventing a number.
It cannot truly tell you why
Data shows what changed and which segments drove it. Why customers behaved that way is a business judgement: a promotion, a stock-out, a festival, a competitor. A tool can point to the biggest drivers, but you supply the explanation.
It cannot fix bad data
Duplicate orders, missing dates, mixed units and inconsistent product names produce confident wrong answers. Data quality checks come before questions.
It cannot read your mind about definitions
"Customers" might mean people who ordered, or people who ordered in the period, or people who ordered more than once. A shared metrics catalogue, where each measure has one written definition, removes most disagreements.
It is not a forecast
Predicting next month is a different task with its own uncertainty. If you want to understand how forecasts and their ranges work, read our guide to demand forecasting and confidence bands.
How do the approaches compare?
| Approach | Good at | Where it falls short |
|---|---|---|
| Spreadsheet and pivot tables | Flexible, familiar, you see every step | Manual refresh, depends on one person, definitions drift between copies |
| Fixed dashboards | Always-on view of the main numbers | Cannot answer a new question without a new build |
| Plain-English questions on a governed data set | Fast answers to new questions, query visible, follow-ups, pinned results | Only as good as the definitions and data, and unusual phrasing can be misread or refused |
If you are not ready for that last row, a good first step is a clean dashboard from a file you already have. Our guide on turning a CSV into a dashboard shows how.
How do you roll it out step by step?
- List the twenty questions you ask most. Revenue by month, returns by product, repeat customers, best stores. These become your test set.
- Write the definitions. One line per measure, covering what is included and excluded.
- Clean the data. Check for duplicates, gaps, odd dates and inconsistent names, and fix them at the source.
- Test the tool on known answers. Run your twenty questions and compare with figures you trust.
- Pin what matters. Turn the answers you check every week into dashboard tiles and scheduled reports.
- Review refusals. The questions it cannot answer tell you which data or phrasing to add next.
What should you ask any vendor?
- Can I see exactly how each question was interpreted, including the measure, filters and dates?
- What does the tool do when it cannot answer? Does it refuse politely or guess?
- Is there a single catalogue of metric definitions I can edit?
- Do the parts of a breakdown add up to the total?
- Who can see which data, and is that enforced by role?
- Can I export results and keep a history of who asked what?
- Is any language model involved, and if so, what leaves my systems?
What mistakes do small businesses make?
- Trusting a clean chart without checking the definition behind it.
- Skipping data cleaning and then blaming the tool.
- Asking "why" and treating a driver chart as proof of cause.
- Letting every person define "customer" or "margin" differently.
- Reading a handful of orders as a trend.
- Giving everyone access to everything, including data they do not need.
What the InsightOcta demo shows
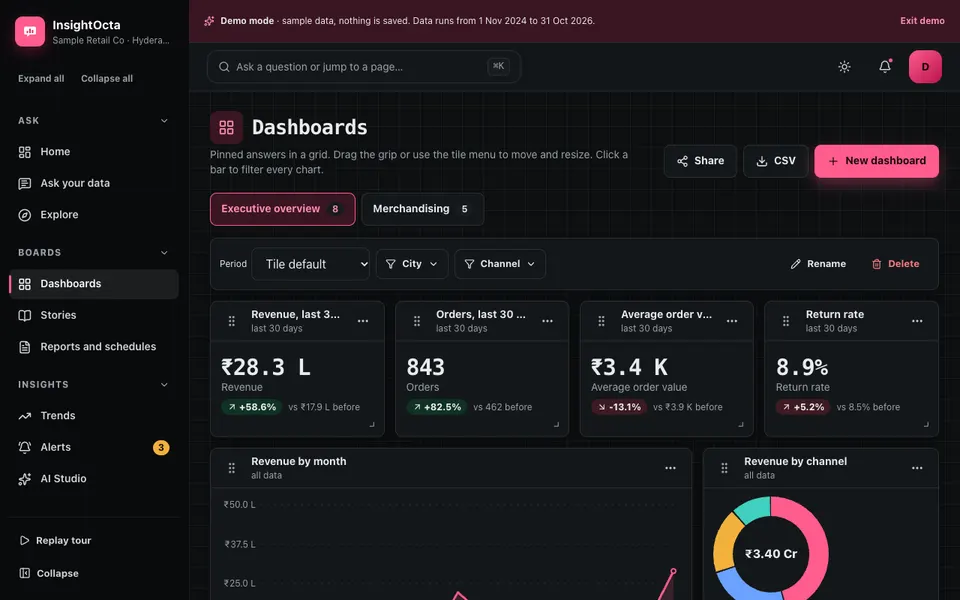
InsightOcta is an interactive "chat with your data" demo for a fictional business called Sample Retail Co. It runs in the browser on sample data: nothing is saved and it resets on refresh. The numbers are real maths over a seeded sample dataset of about 20,000 order lines across 24 months, 48 products, 8 stores in 6 cities and 4 channels. The understanding of your question is simulated: there is no language model, only a rule-based parser that matches words against a vocabulary built from the data. Unusual phrasings get a polite refusal with suggestions.
- Home and Ask. Suggested questions, then a conversation that returns a chart, a table, a sentence and a "How I answered this" panel, with options to pin, copy the query, download CSV and tap follow-up chips.
- Explore. A point-and-click builder for people who prefer to choose than to type.
- Dashboards and Stories. Drag and resize tiles with date, city and channel filters, and build presentable stories from charts, text and KPI blocks.
- Reports, Trends and Alerts. Scheduled reports, biggest movers, unusual days found with a robust statistical test, and threshold and change alerts.
- AI Studio. Five simulated tools: a parse explainer, an insight finder whose drivers add up exactly, a quick forecast with a 95% band, SQL to English and an anomaly explainer.
- Metrics catalogue, data sources and data quality. Fifteen metric definitions, a schema browser with column profiles, real quality checks and a CSV paste importer you can then query. Connections themselves are simulated.
- Sharing, team and audit log. Roles and a log of 100 or more events, with sharing links simulated.
How to try it
Open the InsightOcta live demo, choose Try Demo Account on the login screen and follow the guided tour. In Ask, try a question like revenue by channel last quarter, then tap a follow-up chip and read the "How I answered this" panel. Then ask something it cannot know, such as why sales dropped, and see how it declines. More simulated tools are on the AI demos page. If you are comparing it with a tool for documents rather than numbers, see how chat with company documents differs.
Getting something like this built
A real version starts with your data, not a chat box: where it lives, how clean it is and what each measure should mean. From there, Zenocta can build a question interface, dashboards and reports on top, with roles that match who may see what. Talk to us about a custom build and you will receive a scoped, fixed-price proposal. You can also explore the Zenocta apps to see what we already ship.
Try it live
Open the real thing: demos run in a new tab with sample data, apps link to their own page.
 Live demoInsightOcta live demoAsk a sample retail data set questions in plain English, then explore dashboards, stories, alerts, a metrics catalogue and data quality checks.
- ABrowse allAll AI demosBrowse every AI demo, each with a sample company, nothing saved and simulated AI.
- ZBrowse allZenocta appsProduction apps live on Google Play.
- TBrowse allTalk about a custom buildShare your data sources and key questions and get a scoped, fixed-price proposal.
Frequently asked questions
01How does a tool turn plain English into an answer?
It identifies the measure you want, how to break it down, any filters and the time period, then builds a structured query, runs it on your data and picks a chart. A trustworthy tool shows you how it interpreted the question so you can check it.
02Can I trust numbers from a natural language analytics tool?
Trust them to the extent you can check them. Test with questions whose answers you already know, read the measure and date range used, and confirm that breakdowns add up to totals. Treat any answer you cannot verify as provisional.
03Why can't these tools explain why sales dropped?
Data shows what changed and which products, cities or channels drove the change. The reason, such as a stock-out, a festival or a promotion, lives outside the sales table, so a person has to supply and test the explanation.
04What data quality problems break plain-English analytics?
Duplicate orders, missing or wrong dates, mixed units and inconsistent product names. They produce confident but wrong charts. Run quality checks and fix problems at the source before asking questions, and write one definition for each metric.
05Is the InsightOcta demo using a real AI model?
No. The analytics are real calculations on a seeded sample dataset, but the question understanding is a rule-based parser and the AI Studio tools are simulated. Nothing is saved, and no language model is called.