In this guide
You order stock for next month using last month's sales and a feeling about the festival. Order too little and your best sellers run out in week two; order too much and cash sits on a shelf for a quarter. Demand forecasting for small retailers is the habit of turning past sales into an honest estimate of what is coming, and the word that matters most is honest: a good forecast tells you the likely number and how wrong it might be. This guide explains how forecasts work, what a confidence band really means, and how to turn a forecast into a reorder decision.
How do small retailers plan stock today, and where does it break?
Most shops plan with a mix of memory, a sales spreadsheet and the supplier's suggestion. It works for a few dozen products and one store. It breaks in predictable ways.
- Last month as the forecast. One unusually strong or weak month sends next month's order in the wrong direction.
- Festival timing ignored. A festival that falls early one year and late the next shifts sales between months, and a flat average cannot see it.
- One number with no range. "We will sell 400" sounds precise, but nobody knows whether 300 or 500 would be a surprise.
- Promotions confuse the history. A discount week inflates sales, and the following weeks look weak because customers already stocked up.
- Fast and slow products treated alike. A steady staple and an erratic fashion item need very different safety stock.
The aim is not to predict the future perfectly. It is to replace gut feeling with a method you can check against what actually happened.
How does a sales forecast actually work?
A forecast looks at the shape of past sales and extends it. Three ingredients appear in almost every method.
- Level. Roughly how much you sell in a normal period right now.
- Trend. Whether that level is drifting up or down over time.
- Seasonality. A repeating pattern, such as stronger sales around a festival or weaker ones in the rainy months.
Simple methods use fewer ingredients. A seasonal naive forecast says next March will look like last March. A moving average says next month will look like the average of the last few. A linear trend draws a straight line through history. A method often called Holt-Winters tracks level, trend and seasonality together, updating each as new months arrive. None of these is magic: each is a rule applied to your own history, and each suits a different kind of product.
What does a confidence band mean?
A forecast line is the single most likely path. A confidence band, also called a prediction interval, is the shaded range around it. Read it like this: an 80% band means that, if the model's assumptions hold, about 8 actual results in 10 should land inside the band and about 2 in 10 outside it. A 95% band is wider and should catch about 19 in 20.
Here is a made-up example. A forecast says 400 units of one product next month, with an 80% band of 340 to 460. The sensible reading is "most likely around 400, and a result between 340 and 460 would not surprise me". A result of 350 is normal. A result of 250 would be a signal to look for a cause, such as a stock-out, a promotion or a data error.
Tip
A band is not a promise. It is only as good as the history and the assumptions behind it. New products, a price change, a new competitor or a one-off event can push results outside any band, and a band built on one year of data deserves less trust than one built on three.
Why do bands get wider further ahead?
Each extra month of look-ahead adds uncertainty, so next month's band is narrow and month nine's is wide. A good tool shows this widening instead of hiding it. If a forecast looks equally confident about next week and next year, be suspicious.
How do you know if a forecast is any good?
You test it on the past. A backtest hides the most recent months, forecasts them from the earlier data, then compares the forecast with what really happened. A rolling-origin backtest repeats this at several starting points, which is fairer than one lucky test.
Three measures are common. WAPE (weighted absolute percentage error) adds up the size of the misses and divides by total actual sales. Bias shows whether you tend to forecast too high or too low. Here is a worked example with made-up numbers for three months.
| Month | Actual units | Forecast units | Miss (forecast minus actual) |
|---|---|---|---|
| 1 | 100 | 110 | +10 |
| 2 | 120 | 100 | -20 |
| 3 | 80 | 90 | +10 |
| Total | 300 | 300 | 0 |
The sizes of the misses are 10, 20 and 10, which add to 40. WAPE is 40 divided by 300, about 13.3%. Bias is the signed total, 0, divided by 300, which is 0%. So this forecast is balanced overall, with no tendency to over- or under-forecast, yet still off by about 13% in a typical month. Looking at only one of the two numbers would mislead you, which is why a backtest table should show both.
How do forecasts turn into reorder decisions?
A forecast is only useful if it changes what you buy. Two numbers connect them.
Safety stock
Safety stock is the extra you hold to cover forecast error while you wait for a delivery. A common formula multiplies a service-level factor by the variation in demand and by the square root of the lead time. Made-up example: weekly demand varies by about 20 units (its standard deviation), lead time is 4 weeks, and you want a 95% service level, which uses a factor of about 1.645. Safety stock is 1.645 x 20 x square root of 4 (which is 2), so 1.645 x 20 x 2 = 65.8, about 66 units.
Reorder point
The reorder point is the stock level at which you place an order: average demand during lead time plus safety stock. If average demand is 100 units a week, then 4 weeks of lead time is 400 units, and the reorder point is 400 + 66 = 466 units. When stock on hand falls to 466, order.
Two refinements help a real store. ABC analysis ranks products by value so you spend attention where the money is, and XYZ analysis ranks them by how erratic demand is, so steady items get tight stock and erratic items get a bigger buffer. For a wider look at stock tracking in shops, see our guide to billing and inventory software for small retailers.
How do you roll out forecasting step by step?
- Gather clean history. At least two years of monthly sales per product or category, with returns handled consistently. Fix gaps and obvious errors first.
- Mark the events. Note festivals, promotions, price changes and stock-outs, because a stock-out looks like low demand in the data.
- Start at category level. Forecast categories before single products. Totals are steadier than small items.
- Backtest before trusting. Check error and bias on past months and keep a simple method as the benchmark to beat.
- Add reorder rules. Compute safety stock and reorder points for your top items, then review them monthly.
- Compare plan with actual. Each month, record the miss, note the cause and refit.
What should you ask any vendor about forecasting?
- Does it show a range around the forecast, not just a single number?
- Can I see backtest results, including error and bias, for my own data?
- Does it say which method it used for each product and why?
- Can I mark events such as festivals and promotions, and refit?
- Does it flag unusual months for me to review instead of silently absorbing them?
- Can I export the forecast and the purchase plan?
- Is any AI explanation clearly separate from the maths underneath?
What mistakes make forecasts disappoint?
- Treating the line as a promise and ignoring the band.
- Training on months when you were out of stock, so the model learns that demand was low.
- Over-fitting to a single strong festival season.
- Forecasting every product individually when many have too little history.
- Never checking the forecast against actual results.
- Letting a tool's confident chart replace your own judgement about a new product or a price change.
How do the approaches compare?
| Approach | Good at | Where it falls short |
|---|---|---|
| Memory and last month's sales | Instant, no setup | Chases noise, misses festival timing, no sense of range |
| Spreadsheet with averages and a chart | Transparent, cheap, you control it | Manual refresh, no backtest, no bands, one error breaks it |
| Purpose-built forecasting and planning software | Several methods, bands, backtests, events, reorder maths in one place | Needs clean data, event marking and regular review |
What the ForecastOcta demo shows
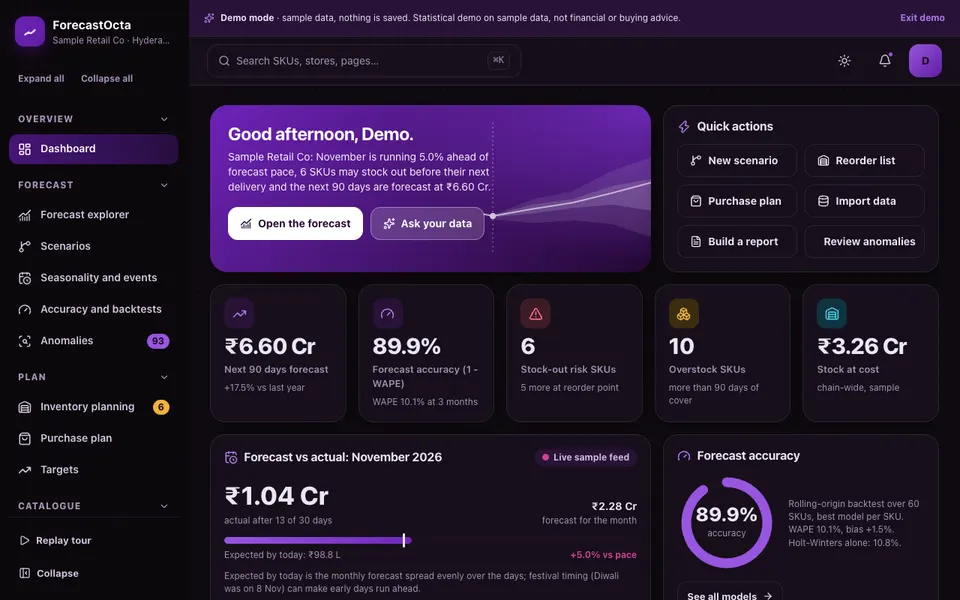
ForecastOcta is an interactive demo of sales forecasting and inventory planning for a fictional business called Sample Retail Co. It runs in the browser on synthetic data: nothing is saved, everything resets on refresh, and it is a statistical demo, not financial or buying advice. The forecasting maths is real code running on that sample data, while the "AI Studio" is simulated: it uses keyword rules to choose which calculation to run, and no language model is called.
- Dashboard. This month against forecast with a live sample feed, a 90-day outlook, an accuracy ring and counts of products at risk of stock-out or overstock.
- Forecast explorer. Forecast the total, a category, a product or a store for 1 to 12 months with seasonal naive, moving average, linear trend or additive Holt-Winters, 80% and 95% bands, an events overlay, a backtest table and an auto-pick option.
- Scenarios. Test a price change, a promotion, a festival uplift, a supplier delay or a new store, save up to four and compare them.
- Seasonality and events, accuracy and anomalies. Decomposition into trend and season, a calendar heat map, backtest measures including WAPE and bias, and unusual sales flagged with a robust statistical test.
- Inventory planning and purchase plan. Safety stock, reorder point, days of cover and ABC and XYZ classes, then draggable order quantities with budget fitting and purchase order drafts.
- Data, reports and alerts. A CSV importer with quality checks, a report builder, alert rules, plus team roles and an audit log.
How to try it
Open the ForecastOcta live demo, choose Try Demo Account on the login screen and take the guided tour. Then open the Forecast explorer, switch the method, and watch how the bands and the backtest table change. Try a promotion in Scenarios and look at the purchase plan afterwards. More simulated tools are listed on the AI demos page.
Getting something like this built
A real forecasting tool would load your own sales history, respect your festival calendar and product structure, and connect to your stock and purchasing process. Methods and thresholds would be agreed with you and tested on your data first. If that is what you need, talk to Zenocta about a custom build and receive a scoped, fixed-price proposal. For ideas on where else automation pays off, see what to look for in software for retail shops, and browse our production apps.
Try it live
Open the real thing: demos run in a new tab with sample data, apps link to their own page.
 Live demoForecastOcta live demoClick through a sample retail forecast: four methods with bands, backtests, scenarios, reorder planning and a purchase plan, all on sample data.
- ABrowse allAll AI demosBrowse every AI demo, each with a sample company, nothing saved and simulated AI.
- ZBrowse allZenocta appsProduction apps live on Google Play.
- TBrowse allTalk about a custom buildShare your sales history and stock process and get a scoped, fixed-price proposal.
Frequently asked questions
01What does an 80% confidence band mean in a sales forecast?
It means that, if the model's assumptions hold, about 8 out of 10 actual results should fall inside the shaded range and about 2 should fall outside. It is a statement about likelihood, not a promise that any single month will land inside.
02Why does the band get wider for later months?
Each extra month ahead adds uncertainty, because errors accumulate and conditions change. A narrow band next month and a wide band nine months out is the honest picture, and a tool that shows the same confidence for both is overstating what it knows.
03What is the difference between WAPE and bias?
WAPE adds up the size of the misses and divides by total actual sales, so it shows typical error. Bias keeps the signs, so over- and under-forecasts cancel and it shows whether you lean high or low. You need both to judge a forecast.
04How much history do I need to forecast demand?
Two years of monthly data is a practical minimum if you want to capture a yearly pattern, and three is better. With less history, forecast at category level and use simple methods, and treat the results as rough guidance.
05Is the ForecastOcta demo advice on what to buy?
No. It is an interactive demo on sample data from a fictional company. The forecasting maths is real code, but the numbers are invented, nothing is saved, and the AI Studio is simulated with keyword rules and no language model.