In this guide
Every Monday someone on the team exports a CSV from the billing tool, pastes it into a spreadsheet, rebuilds the same three charts and emails a screenshot. By Wednesday the numbers have moved and nobody is sure which file is current. This guide shows how to turn a CSV into a dashboard that answers the same questions every week, and what to look for when a small team outgrows the paste-and-screenshot routine.
Why does reporting break down in small teams?
Small finance, operations and agency teams rarely lack data. They lack a repeatable path from data to a decision. The breakdown follows a familiar pattern.
- The report lives in one person's head. Only one colleague knows which columns to filter and which rows to ignore.
- Every chart is rebuilt by hand. A new export means new formulas, new ranges and new chances for a silent error.
- Definitions drift. "Revenue" means gross in one tab and net of refunds in another, and a client meeting turns into an argument about the number instead of the business.
- Everyone sees everything. A regional manager receives the full file because filtering it per person is tedious.
- Nobody notices the slow problems. A refund rate creeping up for three weeks is invisible in a file that is only opened at month end.
A reporting tool fixes these by separating four things that a spreadsheet mixes together: the data, the question, the picture and the delivery.
What are the building blocks of a dashboard?
You do not need analytics jargon to use a reporting tool, but five terms come up constantly, so it helps to know them.
Dataset, dimension and measure
A dataset is the table: one row per order, visit or subscription. A dimension is a column you group by, such as region, product or month. A measure is a number you calculate, such as a sum, an average, a count or a median. Almost every dashboard tile is "this measure, grouped by that dimension, for this period".
Grain
Grain is what one row represents. If a CSV has one row per order line but you report "number of orders", you must count distinct order numbers, not rows. Getting grain wrong is the most common reason two reports disagree.
Calculated fields and joins
A calculated field is a new column built from old ones, for example margin as revenue minus cost. A lookup join attaches a second table, such as a store directory, to your data. A good tool tells you the match rate, so you know how many rows found a partner and how many did not.
Row-level security
Row-level security means two people open the same dashboard and see different rows. A regional manager sees only their own region, while the owner sees everything. It is a rule applied inside the query, not a hidden column.
How do you turn a CSV into a dashboard, step by step?
- Write the questions first. Three to five, in plain words: "How is revenue trending?", "Which region is slipping?", "What is the refund rate this month?"
- Load the file and read the profile. Check each column's type, how many values are empty, the minimum and maximum, and the most common values. A date column read as text, or a total column with blanks, is cheaper to catch now than after the charts exist.
- Fix names and types. Rename cryptic headers, mark numbers as numbers and dates as dates, and hide columns nobody needs.
- Define measures once. Decide what revenue, margin and refund rate mean, write the definition down, and reuse it everywhere.
- Explore before you chart. Group, filter and sort the table, and read the plain-words summary of the query to confirm it is asking what you think it is asking.
- Pick a chart for each question. Lines for trends, bars for comparisons, a donut only for a few parts of a whole, a table when people need exact figures.
- Add a global filter bar. Date range and one or two key fields, so one dashboard serves many questions.
- Schedule and alert. Decide who gets the report, how often, and which thresholds should raise a flag.
A worked example with made-up numbers
Suppose a small retailer exports a CSV with one row per order and a region column. Here are sample figures, invented for illustration.
| Region | Revenue (sample) | Share of total |
|---|---|---|
| North | ₹1,20,000 | 40% |
| South | ₹90,000 | 30% |
| East | ₹60,000 | 20% |
| West | ₹30,000 | 10% |
| Total | ₹3,00,000 | 100% |
The four rows add up to ₹3,00,000, and each share is its revenue divided by that total. A pivot table should always reconcile to the flat query, so if your pivot grand total says anything other than ₹3,00,000 for the same filter, something is wrong with a join or a filter.
Now compare periods. If last month was ₹3,00,000 and this month closed at ₹3,30,000, growth is 30,000 divided by 3,00,000, which is 10%. But if you look on the 15th, when this month holds only ₹1,20,000, a naive chart shows a 60% collapse. The month is simply unfinished.
Tip
Never compare a part-finished period with a finished one. Good tools draw the current month dashed or faded, and ignore it when evaluating alerts. If your tool does not, add a note on the chart or leave the current period out.
Which chart for which question?
Most reporting confusion is a chart-choice problem, not a data problem.
- Trend over time: a line or area chart. A moving average smooths noisy daily figures so a real change stands out. For three weekly values of 40, 50 and 60 units, the three-week moving average is 50.
- Ranking or comparison: a bar chart, sorted. Show the top few and group the remainder as "Other" so the chart stays readable.
- Parts of a whole: a donut or stacked bar, but only with a handful of slices.
- Two measures on different scales: a combination chart with two axes, such as revenue as bars and margin percentage as a line.
- Stages that lose volume: a funnel. Start, additions and subtractions: a waterfall.
- Exact figures for a meeting: a table, ideally with colour scaling so the eye finds the outliers.
Whatever you choose, make sure a colour-blind reader and a screen-reader user can still get the point. That means patterns or dashes as well as colour, text summaries and a "view as table" option.
Spreadsheet, hand-built charts or a purpose-built reporting tool?
| Need | Spreadsheet | Hand-made slides | Purpose-built reporting tool |
|---|---|---|---|
| Refresh with a new export | Manual re-paste, formulas can break | Rebuild every chart | Load the file, tiles update |
| One definition of a metric | Scattered across tabs | In the presenter's head | Central glossary |
| Different views per person | Separate files | Separate decks | Role rules inside the query |
| Scheduled delivery | Someone remembers | Someone remembers | Schedule with a preview |
| Threshold warnings | Conditional colours, if anyone looks | None | Alert rules and a feed |
| Audit trail of who changed what | Version history at best | None | Activity log |
A spreadsheet remains the right tool for one-off analysis. The case for software starts when the same report is rebuilt more than a few times, or when more than one person depends on it. If you are weighing where else a small business can cut routine manual work, our guide on how MSMEs can reduce costs through digital transformation covers the wider picture.
What to ask any reporting-software vendor
- Can I load my own CSV, and what happens with quoted fields, semicolon separators and a byte-order mark?
- Does it show a column profile and data-quality warnings before I build anything?
- Can I define a calculated field without writing code, and is the formula checked?
- When I join two tables, do I get a match-rate report?
- Do totals in pivots reconcile to the underlying query on screen?
- Is row-level security enforced in the query itself, or only hidden in the interface?
- Are incomplete periods marked, and ignored by alerts?
- Can people with a keyboard or a screen reader use every chart?
- Can I print a clean paginated report without a separate tool?
- Where does my data go when I load a file: is it uploaded anywhere?
Mistakes teams make with dashboards
- Too many tiles. A dashboard with thirty charts is a wall. Start with five to eight that map to your written questions.
- Averaging averages. The average of regional averages is not the overall average unless the regions are the same size. Compute it from the rows.
- Ignoring empty values. Blank cells silently shrink counts and means. Read the null count in the profile.
- Mixing date conventions. A date like 05/03/2026 means different days in different countries. Agree on day-first or month-first and state it.
- Setting the fiscal year wrongly. If your year starts in April, quarters need to follow, otherwise every quarterly figure is off.
- Alerts without owners. A flag that nobody acknowledges becomes background noise within a fortnight.
What the ReportOcta demo shows
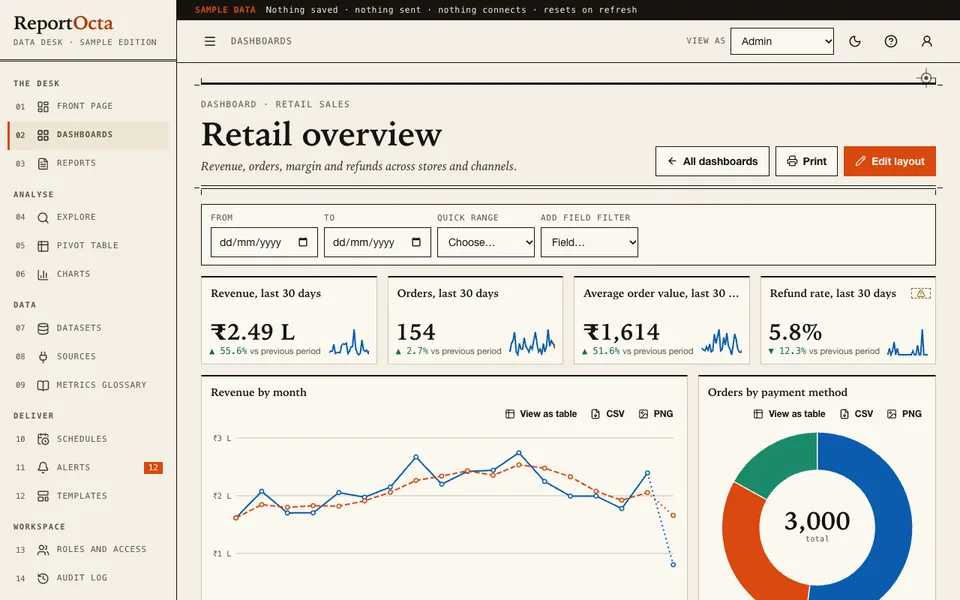
The ReportOcta demo is an interactive example of the workflow above. It runs in the browser on desktop, tablet and phone layouts. Everything in it is sample data for fictional companies, nothing is saved or sent, nothing connects to a real system and it resets when you refresh. It also contains no AI: every number comes from plain, deterministic calculation.
- Datasets: four generated samples (retail, SaaS subscriptions, clinic visits, delivery orders) plus a store directory. You can also load a CSV by button, drop or paste. It copes with quoted fields, different separators and a 5 MB limit, and nothing is uploaded. A column profile, quality warnings, calculated fields and a lookup join with a match-rate report show how to prepare data safely.
- Explore: measures, group by, date buckets, filters, top-N with "Other", comparison with the previous period, running total, percent of total, moving average and a plain-words summary of the query.
- Charts and pivot: bar, stacked, line, area, combination, donut, scatter, heatmap, funnel, waterfall, big number with sparkline and a colour-scaled table, with tooltips, a table view and CSV or image export. The pivot adds subtotals, grand totals and heat shading, and its totals are checked against the flat query on screen.
- Dashboards: add, move and resize tiles with mouse, keyboard or buttons, use a global filter bar and click a mark to cross-filter.
- Reports: a paginated builder with headings, text, charts and tables, plus a print stylesheet for a clean A4 PDF from the browser print dialog.
- Schedules (simulated): daily, weekly or monthly, with a business-day option, the next five runs and an email preview. Nothing is sent.
- Alerts, glossary, roles, audit log, templates: threshold and change alerts with acknowledge and mute, a metrics glossary, four roles including a Region Manager limited by row-level security, an audit log, templates, and settings for Indian lakh and crore or international number grouping and the fiscal-year start.
The demo is honest about its limits: it is single-user and in-memory, dashboards bind to one dataset and sources other than CSV are placeholders. That is the point of a demo. It shows the shape of the product so you can decide what a real version should include.
How do you try it in five minutes?
- Open the demo and choose Try Demo Account on the login screen.
- Open Dashboards and read the retail overview, then switch to edit layout and move a tile.
- Go to Explore, group revenue by region, and turn on comparison with the previous period.
- Switch "View as" to Region Manager and watch the numbers shrink to one region.
- Open Schedules and read the email preview, then check Alerts for what is flagged.
The hub at all Zenocta demo apps lists the other industry demos if your work sits closer to sales, operations or support. For a different kind of data problem, see how we approach billing and inventory software for retail shops.
Getting a reporting tool like this built for your team
A real reporting build starts from your own data: the exports you already receive, the five questions your team asks every week and the people who should see only part of the numbers. Live connections, real scheduled email delivery and saved dashboards are the pieces a demo deliberately leaves out. Zenocta builds these as a scoped, fixed-price proposal, so you know what you are buying before work begins. Our own apps are listed on the Zenocta apps page if you want to see what we ship in production. When you are ready, tell us about your reports and we will come back with a plan.
Try it live
Open the real thing: demos run in a new tab with sample data, apps link to their own page.
 Live demoReportOcta live demoExplore datasets, charts, pivots, dashboards, reports, simulated schedules and alerts, all on sample data.
- ABrowse allAll demo appsBrowse every interactive industry demo and open the one closest to your business.
- ZBrowse allZenocta appsProduction apps live on Google Play.
- TBrowse allTalk about a custom buildDescribe your reports and get a scoped, fixed-price proposal.
Frequently asked questions
01Can I really turn a CSV into a dashboard without coding?
Yes. The usual route is to load the file, check each column type, define a few measures, group by a dimension such as region or month, then place the results as chart tiles. Formulas for calculated fields can be typed in plain terms.
02What is the difference between a pivot table and a dashboard?
A pivot table is one grid of grouped totals, good for checking exact figures. A dashboard combines several tiles, charts and numbers with shared filters so a team can read the whole picture at a glance.
03Why do my report totals not match between two views?
Common causes are a different grain, such as rows versus distinct orders, empty values being skipped, filters that differ between views, or a join that dropped unmatched rows. Check the match rate and compare against the flat query.
04Does the ReportOcta demo send real scheduled emails?
No. Schedules in the demo are simulated: you can set a frequency, see the next five runs and read an email preview, but nothing is sent. The data is sample data, nothing is saved and the page resets when you refresh.
05How would a custom reporting tool differ from the demo?
A custom build would start from your own exports or systems, with live connections, real delivery, saved dashboards and your roles. Zenocta scopes that as a fixed-price proposal after hearing which questions your team needs answered.