In this guide
Monthly recurring revenue can climb for a year while the business underneath gets weaker: new customers hide the ones leaving, and a few large upgrades hide a long tail of small cancellations. Founders of SaaS and membership businesses usually discover this when growth stalls, not before. This guide covers subscription billing software, dunning and MRR tracking, and the handful of views that tell you what is really happening.
It describes software for running a subscription business. The figures are invented to show arithmetic. For tax treatment, invoicing rules and recurring-payment rules, check the current rules and ask your accountant.
Why can MRR rise while the business gets weaker?
MRR is a total, and a total hides its parts. Every month, recurring revenue moves in five ways:
- New: revenue from customers who just subscribed.
- Expansion: existing customers who upgrade or add seats.
- Reactivation: former customers who come back.
- Contraction: existing customers who downgrade.
- Churn: customers who cancel.
Here is an invented month, in rupees:
| Movement | Amount (₹) |
|---|---|
| Opening MRR | 10,00,000 |
| New | +80,000 |
| Expansion | +40,000 |
| Reactivation | +10,000 |
| Contraction | -20,000 |
| Churn | -50,000 |
| Closing MRR | 10,60,000 |
Net new MRR is 80,000 + 40,000 + 10,000 - 20,000 - 50,000 = 60,000, so MRR grew 6%. But gross churn took 5% of opening revenue in a single month, and net revenue retention (opening plus expansion, minus contraction and churn, divided by opening, ignoring new and reactivation) was 9,70,000 divided by 10,00,000, or 97%. The business grew only because it sold more, while its existing base shrank by 3%. A waterfall chart of these five movements, month by month, is the single best view of subscription health because it separates growth you bought from decline you did not notice.
How do you read a cohort retention heatmap?
A cohort is a group of customers who signed up in the same month. A heatmap lays out cohorts down the side and months since signup across the top, with each cell showing how much of the original group is still there. Colour does the work: a row that fades quickly is a bad cohort, a column that fades for every cohort is a product or onboarding problem.
An invented cohort of 50 customers who paid ₹2,000 a month each, so ₹1,00,000 of MRR at the start:
| Months since signup | Customers left | Logo retention | MRR (₹) | Revenue retention |
|---|---|---|---|---|
| 0 | 50 | 100% | 1,00,000 | 100% |
| 3 | 41 | 82% | 84,000 | 84% |
| 6 | 36 | 72% | 78,000 | 78% |
Revenue retention is a little higher than logo retention because some of the customers who stayed upgraded. Look at both. Logo retention tells you whether people want the product, revenue retention tells you whether the plan ladder works. Useful filters are plan and acquisition channel, because a cohort from a discount campaign often behaves differently from one that came through referrals. Clicking a cell should list the actual customers, so that the heatmap leads to a call, not just a chart.
Tip
Annotate cohorts with what you did that month: a campaign, a price change, a new onboarding flow. A heatmap with notes becomes a history of decisions, and the next person to read it does not have to guess.
What is involuntary churn and how does a dunning board recover it?
Some customers do not cancel: their payment fails. A card expires, a mandate lapses, a UPI request is not approved in time. This is involuntary churn, and it is usually the cheapest churn to fix because the customer never decided to leave. Dunning is the process of retrying and reminding, and a board makes it visible.
A simple schedule, similar to the one the demo uses, has stages: Retry 1 on day 1, Retry 2 on day 3, Retry 3 on day 5 and a final notice on day 7, with a recovered column for those who paid. Each stage has a message template, for instance a gentle "your payment did not go through" first, then a link to update the payment method, then a notice that the subscription will pause. Here is an invented month:
| Stage | Recovered at this stage |
|---|---|
| Retry 1 (day 1) | 21 |
| Retry 2 (day 3) | 9 |
| Retry 3 (day 5) | 4 |
| Final notice (day 7) | 2 |
| Recovered of 60 failed | 36 (60%) |
Of 60 failed invoices, 36 came back, a 60% recovery rate. The other 24 are now churn. If you do nothing, all 60 are. Two practical lessons follow. Most recovery happens early, so the first retry and first message deserve the most care. And the failure rate differs by payment mode (UPI, card and e-Mandate behave differently), so track recovery per mode. Recurring-payment rules for cards and mandates change, so check the current rules when you design retries.
How do you set prices and trials without guessing?
Plans, add-ons, trial length and coupons are levers, and each can be tested on paper before it touches customers. Take a price change. Suppose 200 customers pay ₹3,000 a month, so ₹6,00,000. You raise the price by 10% to ₹3,300. If nobody leaves, MRR becomes ₹6,60,000. But the break-even is where revenue returns to ₹6,00,000: 6,00,000 divided by 3,300 is about 181.8 customers. So if more than 18 of the 200 leave (9%), you are worse off than before.
That is a question worth asking before every price change: how many customers could I lose before this loses money? A price-change simulator makes this a two-minute exercise rather than a debate. Trials and coupons deserve the same discipline. Track trial-to-paid conversion and see which coupon codes bring customers who stay. A heavy discount that fills the top of the funnel but empties by month three will show up clearly in the cohort heatmap.
Invoices, GST and revenue recognition
A subscription business issues the same invoice thousands of times, so automation matters, and so do credit notes for refunds and corrections. Keep every invoice linked to the customer, the plan and the payment attempt, and make failed invoices a separate list so that finance can see them. How tax appears on an invoice depends on the current rules, so keep that configurable and confirmed by your accountant.
Annual plans add another idea: billing is not revenue. Suppose a customer pays ₹36,000 for a year in April. You collect ₹36,000 in April, but if you spread the revenue evenly across 12 months, you recognise ₹3,000 each month. After April, May and June, ₹9,000 has been recognised and ₹27,000 remains deferred. A deferred revenue schedule shows this per customer. How you recognise revenue is an accounting decision, so confirm your method with your accountant. The point for software is that billings and recognised revenue are two different columns and both must be reported.
Why do customers leave, and who is about to?
Two inputs are worth capturing. The first is an exit survey: ask each cancelling customer for a reason from a short list (price, missing feature, support experience, low usage, business closed, payment failure) and link the answer to the support history. A bar chart of reasons will often contradict what the team believes. The second is a set of signals for at-risk accounts: a long time since last login, low usage of the main feature, few seats used, a past-due payment or several recent support tickets. Combine them into a watch list for customer success, who can then reach out before the cancellation. Any score built from these signals is a prompt for a person to act, not a verdict. For a look at the support side of this loop, see our guide to helpdesk software for small support teams.
Spreadsheet, payment gateway dashboard or purpose-built software?
| Question | Spreadsheet | Payment dashboard alone | Purpose-built subscription software |
|---|---|---|---|
| MRR movement by type | Manual each month | Payments only, no plans | Waterfall from subscription changes |
| Cohort retention | Heavy pivot work | Not available | Heatmap by plan and channel |
| Failed payment recovery | Manual follow-up | Basic retries | Staged board with templates |
| Invoices and credit notes | Copy and paste | Per payment | Linked to customer and plan |
| Annual plan deferral | Own formulas | Not tracked | Schedule per customer |
| Price-change what-if | Ad hoc | Not available | Simulator on live data |
Questions for any vendor
- Can I see MRR split into new, expansion, reactivation, contraction and churn, month by month?
- Can I filter the cohort heatmap by plan and channel, and click through to customers?
- Can I define my own dunning stages, timing and message templates?
- Does each invoice link to a customer, plan and payment attempt, and are credit notes supported?
- Can I export every table, and my data if I leave?
- Who on my team can see revenue and who can only see support data?
A rollout that works
- Export current customers, plans and payments, and agree one definition of each metric.
- Import and reconcile MRR with your books for the last full month.
- Switch on the dunning board first, since recovery pays back fastest.
- Build the cohort view and annotate past campaigns.
- Only then add price simulation, coupons and forecasts.
Common mistakes
- Mixing annual and monthly plans without normalising to monthly, which distorts MRR.
- Counting a paused customer as churned (or as active) without a rule.
- Judging retention only by logos, never by revenue.
- Treating a forecast or a churn score as a fact. Both are estimates.
What the SubscribeOcta demo shows
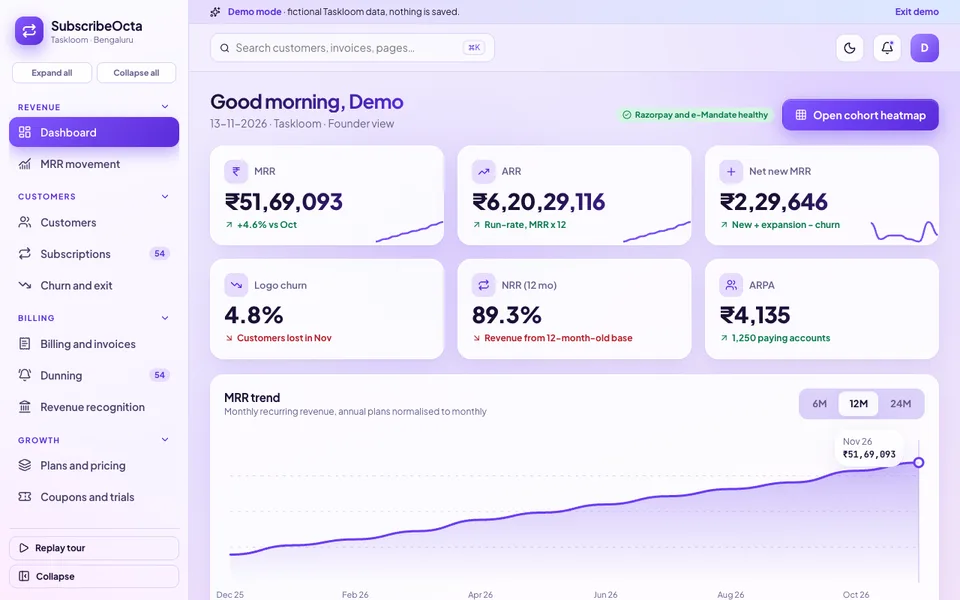
SubscribeOcta is an interactive demo of subscription billing and retention for SaaS and membership businesses, built by Zenocta to show what a custom system could contain. It uses a fictional company called Taskloom and runs in the browser on desktop, tablet and phone, in light or dark. All data is made up, nothing you do is saved, the data resets on refresh, and every AI-style tool is simulated.
- Dashboard and MRR movement. MRR, ARR, net new MRR, logo churn, net revenue retention and ARPA, an MRR trend, plus the five-way MRR waterfall.
- Customers, Subscriptions, Churn and exit. A 360 view per account; lifecycle states of trial, active, past due, paused and cancelled with upgrade, downgrade, pause and cancel; and exit reasons with at-risk accounts.
- Billing and invoices, Dunning, Revenue recognition. GST invoices paid by UPI, card or e-Mandate with failed invoices and credit notes; the drag dunning board with retry schedule and templates; and a deferred revenue schedule.
- Plans and pricing, Coupons and trials. Editable plans and add-ons, a price-change simulator, trial settings, discount codes and trial-to-paid conversion.
- Cohort retention. The heatmap, toggled between logo and revenue retention, filtered by plan and channel.
- Reports, Team, Settings. Tables that export to CSV, role permissions and workspace rules for dunning, invoicing and webhooks.
- Revenue Studio. Seven simulated assistants: churn predictor, price impact, dunning optimiser, cohort narrator, upsell finder, forecast and exit summariser. They are scripted from the demo data, to show where analysis could sit.
How to try it
- Open the SubscribeOcta demo and choose Try Demo Account on the login screen.
- Open Cohort retention, switch between logo and revenue, filter by channel and click a cell.
- Open Dunning and drag a failed payment to the next retry stage.
- Open MRR movement and read the waterfall for the latest month.
- Run the price simulator in Plans and pricing, then try the Revenue Studio tabs.
The login offers roles for Founder, Finance, Customer Success and Support. More demos are on the demo apps page, and our production mobile apps are under apps. If you also issue invoices outside a subscription system, our guide to GST billing software for small businesses may help.
Getting subscription software built for your business
Plans, billing cycles, payment modes and reporting needs differ for every business, and a custom build starts from yours. Zenocta works from a scoped, fixed-price proposal: we agree the modules for a first release, such as customers, invoices and the dunning board, and extend once real usage shows what matters. To discuss it, get in touch. If you are still deciding what to build first, our post on how to build an MVP without wasting your budget is a useful companion.
Try it live
Open the real thing: demos run in a new tab with sample data, apps link to their own page.
 Live demoSubscribeOcta live demoClick through the cohort heatmap, dunning board, MRR movement, GST invoices and Revenue Studio for a fictional company.
- ABrowse allAll demo appsBrowse every interactive industry demo Zenocta has built.
- ZBrowse allZenocta appsProduction apps live on Google Play.
- TBrowse allTalk about a custom buildDescribe your plans and billing cycles and we will scope a fixed-price proposal.
Frequently asked questions
01What is dunning in subscription billing?
Dunning is the process of retrying failed payments and reminding customers to fix them. A typical flow retries on set days, sends a message at each stage, and ends with a final notice before the subscription pauses or ends.
02What is MRR and how is it different from revenue?
MRR is the monthly recurring revenue from active subscriptions, with annual plans normalised to a month. Recognised revenue is an accounting figure: a yearly payment received up front is spread across the months it covers.
03How do I read a cohort retention heatmap?
Each row is a signup month and each column is months since signup. Cells show how many customers, or how much revenue, remain. A row that fades fast is a weak cohort, and a column that fades for all rows points to onboarding or product.
04Is SubscribeOcta a real billing product?
No. It is an interactive demo using a fictional company and made-up data. Nothing is saved, the data resets on refresh, and the Revenue Studio assistants are simulated. It shows what Zenocta can build for a subscription business.
05How do I get subscription billing software built for my business?
Share your plans, billing cycles, payment modes and the reports you need. Zenocta will scope a first release and send a fixed-price proposal. Start through the contact page, and confirm tax and recurring-payment rules with your advisers.