In this guide
A supervisor walks the floor with a clipboard, the stores clerk updates a register at the end of the day, and the owner learns about yesterday's breakdown over tea. The machines are busy, yet nobody can say how much of their capacity was really used. Production management software for small manufacturers closes that gap, and the number that summarises it best is OEE.
How production is tracked in most small plants today
In a typical unit with ten to twenty machines, the record of production is spread across four places. Work orders sit in a notebook or a spreadsheet. Machine stoppages are remembered, not logged. Quality checks are paper sheets that get filled in at the end of the shift. Raw material issues are written in the stores register, often after the material has already been used.
That arrangement works until something goes wrong. A customer rejects a lot, and you cannot say which machine, which shift or which material batch it came from. A key order slips by two days, and the real reason, a changeover that ran long on Tuesday, was never written down. Overtime gets approved to catch up, but nobody can show whether the problem was capacity or lost time.
The breakage points are predictable. Data is entered late, so it is rounded. Different people keep different files, so totals disagree. Downtime has no reason attached, so it cannot be fixed. And the owner sees a monthly summary when the useful moment was last Tuesday afternoon.
What is OEE, in plain words?
OEE stands for overall equipment effectiveness. It tells you what share of your planned production time was truly productive. It is built from three questions, each one a percentage:
- Availability: of the time the machine was supposed to run, how much did it actually run? Stops, breakdowns and long setups reduce it.
- Performance: while it ran, how fast was it compared with its ideal cycle time? Slow cycles and micro-stops reduce it.
- Quality: of the pieces made, how many were good the first time? Scrap and rework reduce it.
Multiply the three and you get OEE. Because it is a product, small losses in each factor compound.
A worked example with made-up numbers
These figures are illustrative, not from any real plant. Take one machine on one shift.
| Step | Working | Result |
|---|---|---|
| Planned production time | One 8 hour shift | 480 min |
| Stops (breakdown, setup, waiting) | Logged by the operator | 60 min |
| Availability | 420 / 480 | 87.5% |
| Ideal cycle time | 30 seconds a piece | 840 pieces possible in 420 min |
| Performance | 600 made / 840 possible | 71.4% |
| Quality | 570 good / 600 made | 95.0% |
| OEE | 0.875 x 0.714 x 0.950 | 59.4% |
The machine was never idle for long and the reject rate looks fine. Yet the shift delivered under 60 percent of its potential, and the largest single loss is speed. Without the cycle time and the stop log you would never see that.
Tip
Do not compare your OEE with a number you read online. Compare each machine with itself over weeks, and look at which of the three factors moves. The trend and the reasons matter more than the headline figure.
Where the lost time really hides
Owners tend to blame breakdowns, because they are visible and expensive. In practice small plants lose more time to the quiet categories: waiting for material, waiting for a QC sign-off, long changeovers between jobs, operators away from the machine, and a slow first hour after a shift change. Each is five to fifteen minutes, which feels too small to record, and together they dominate the day.
A downtime Pareto chart makes this visible. It ranks stop reasons from largest to smallest, so the first two bars tell you where to start. The condition is that operators must tag every stop with a reason from a short list. If the list has thirty options, nobody uses it. Eight to twelve reasons is a workable length for most shops.
The modules a production system needs to connect
OEE alone is a scoreboard. To act on it you need the surrounding records to talk to each other:
- Work orders: what to make, how many, by when, and on which machine, with a status that changes as work moves.
- Planning: a schedule view that shows clashes, such as two jobs on one machine or a job planned during maintenance.
- Bill of materials (BOM): the parts and sub-assemblies behind each product, so a work order can calculate the raw material it will consume.
- Inventory and purchase requests: so a shortfall raises a request before the job starts, not after the machine is waiting.
- Quality: inspection records, trend charts and a way to log non-conformance.
- Maintenance: a calendar of planned work and a ticket list for breakdowns.
The point of joining them is simple: when an operator stops a machine, the work order, the schedule and the maintenance list should all know about it. If each lives in a different tool, someone has to retype the event, and they will not.
Spreadsheet, paper or purpose-built software?
| Approach | Works well when | Where it breaks |
|---|---|---|
| Paper registers | One or two machines, one owner on the floor all day | No summary, late entry, nothing to search when a customer complains |
| Spreadsheets | A single planner who maintains the file carefully | Several versions, no live machine status, formulas break, no audit trail |
| Purpose-built production software | Several machines, shifts and work orders in motion | Needs a clear scope and some discipline from supervisors; a poor fit if it copies a generic ERP you do not need |
Spreadsheets are not the enemy. Many successful plants start there. The signal to move on is when two people argue about which file is right, or when the planner becomes the only person who understands the workbook.
How to roll out production software without stalling the floor
- Pick one line and one shift. Do not launch plant-wide. A small pilot exposes the awkward screens quickly and costs little to fix.
- Write down the machine list and ideal cycle times. Use the setter's honest figure, not the catalogue figure. OEE is only as good as this baseline.
- Agree a short stop-reason list. Eight to twelve reasons, in the words your operators already use.
- Load open work orders and one product's BOM. Start with the product you make most often.
- Run the old and new records side by side for two weeks. Compare totals each Friday and fix the differences.
- Review the Pareto in a short weekly meeting. Pick one loss to attack. The software earns its place when a decision comes out of the chart.
- Extend to the next line. Reuse the reason list, then refine it.
Questions to ask any vendor
- Can an operator log a stop and its reason in under ten seconds, on a phone or a shop-floor screen?
- Does it calculate availability, performance and quality separately, or only show one blended figure?
- Can we set our own ideal cycle times and stop reasons?
- Does a work order calculate its raw material need from the BOM?
- Does the schedule warn about machine clashes and planned maintenance?
- Can we export data in a standard format if we leave?
- Does it follow Indian formats: lakh grouping, GST fields, dd-mm-yyyy dates?
- Who owns the data, and where is it hosted? Ask for hosting and support costs in writing, separate from the build price.
Mistakes that make production software fail
- Measuring everything on day one. Twenty dashboards nobody reads are worse than three that are discussed weekly.
- Using OEE as a punishment. If operators fear the number, they will log stops as something harmless. Present it as a tool for removing obstacles.
- Skipping the baseline. Without honest cycle times, performance is fiction.
- Treating maintenance as separate. Planned maintenance windows must appear in the schedule, or the planner will book jobs over them.
- Buying a generic ERP for a ten-machine plant. Heavy modules for finance, HR and procurement add weeks of setup. Start with what the floor needs.
For a wider view of automating a plant, our guides to production management software for manufacturers and business automation ideas for manufacturing companies go through the earlier steps in more detail, and how MSMEs can reduce costs through digital transformation covers the business case.
What the FactoryOcta demo shows
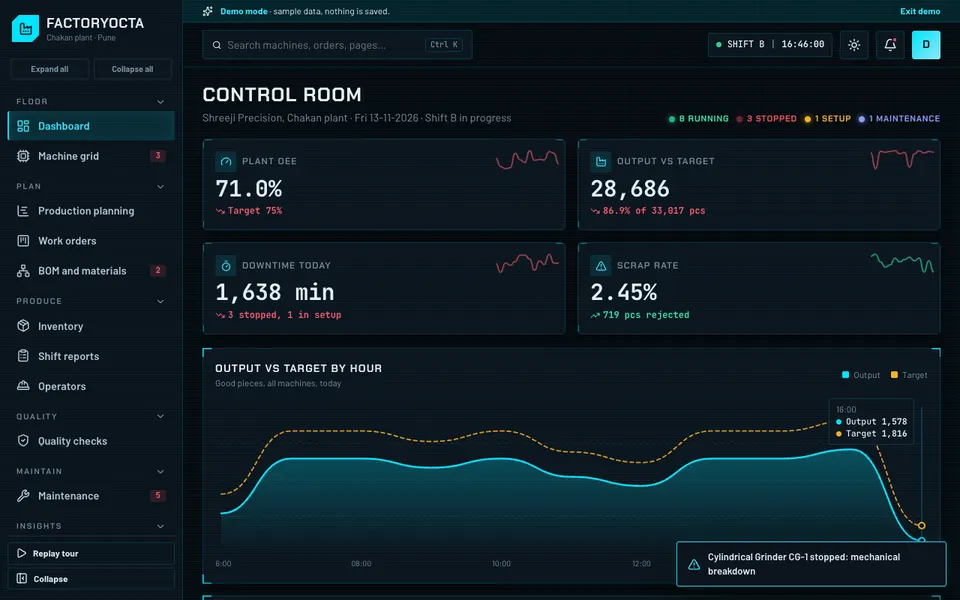
FactoryOcta is an interactive demo of shop-floor control for a small manufacturer, built by Zenocta. It is set in a sample precision-parts plant. Everything in it is sample data held in your browser: nothing is saved, it resets when you refresh, and the tools in its Floor Studio are simulated, using fixed rules rather than a real AI model.
Here are the real modules and why each one matters:
- Dashboard: plant OEE, output against target, downtime, scrap and live events in one view. This is the owner's morning screen.
- Machine grid: 14 machines, each with availability, performance and quality rings and ticking cycle counts. A detail panel lists downtime reasons and controls. It shows how the three OEE factors look side by side.
- Work orders: a drag-and-drop kanban, so status changes are one gesture rather than a phone call.
- Production planning: a Gantt chart you can drag, with clash and maintenance detection and an auto-resolve option.
- BOM and materials: a multi-level tree, material requirement calculation, an item master and purchase requests.
- Inventory, Shift reports and Operators: stock, a summary for each shift, and a roster you can drag together with attendance.
- Quality: an inspection form, an SPC chart with Cp and Cpk, plus non-conformance reports and a Pareto.
- Maintenance: a calendar, tickets, and MTBF and MTTR figures.
- Reports: a downtime Pareto and an OEE trend.
- Floor Studio: predictive maintenance, a schedule optimiser, defect detection from a photo, a root-cause analyser, an energy advisor, a shift report writer and demand planning. All seven are scripted demonstrations, so treat them as a picture of what could be built, not as working models.
It also uses Indian conventions, such as lakh grouping, dd-mm-yyyy dates, +91 phone numbers and GST fields, and it has a layout for desktop, tablet and phone, so you can judge how a supervisor would use it standing at a machine.
How to try it in two minutes
Open the FactoryOcta demo and choose Try Demo Account on the login screen. There is no sign-up. A short guided tour starts, and you can skip it. Then try three things: stop a machine from the machine grid and watch the dashboard react, drag a work order across the kanban, and drag a job in the planning Gantt onto a maintenance window to see the clash warning. If you want to compare it with other industries, the full list of demo apps is one click away.
Getting something like this built for your plant
Every plant has its own machines, stop reasons, forms and customers, so the useful version of this software is rarely the generic one. A demo like FactoryOcta is a starting point for a conversation: which screens you would keep, which you would drop, and what your operators actually need on a phone or a shop-floor display. Zenocta, a Hyderabad software studio with 11 people, whose most experienced members have more than nine years in the field, builds custom software for businesses in India and abroad. We reply with a scoped, fixed-price proposal rather than an open-ended estimate. If that sounds useful, tell us about your plant, and we can also show you our production apps on Google Play.
Try it live
Open the real thing: demos run in a new tab with sample data, apps link to their own page.
 Live demoFactoryOcta live demoOpen the machine grid, work order kanban, planning Gantt, SPC charts and maintenance calendar with sample data.
- ABrowse allAll demo appsBrowse every interactive industry demo, from warehouses to hotels.
- ZBrowse allZenocta appsProduction apps live on Google Play.
- TBrowse allTalk about a custom buildDescribe your plant and get a scoped, fixed-price proposal.
Frequently asked questions
01What is a good OEE score for a small manufacturer?
There is no single right figure, because it depends on the process and product mix. Instead of chasing a benchmark from the internet, measure each machine for several weeks, find which of availability, performance or quality is lowest, and improve that one first.
02Do I need machine sensors to track OEE?
Not to begin. Operators can log stops, counts and reasons manually, and many plants start that way. Sensors or PLC connections make the counts automatic later, but the stop-reason discipline and the baseline cycle times matter more than the hardware.
03Is production management software the same as ERP?
No. ERP usually covers finance, HR, sales and purchasing along with production. Production management software focuses on the shop floor: work orders, planning, BOM, quality, maintenance and machine status. A small plant often gets more value from the focused version first.
04Is the FactoryOcta demo a real product I can buy?
No. It is an interactive demo with sample data that shows what Zenocta can build. Nothing is saved, it resets on refresh, and its AI tools are simulated. A real system would be scoped around your own plant and quoted as a fixed-price proposal.
05How long does a custom production system take to build?
It depends on how many modules you need and how clean your existing data is. We scope it after a conversation about your machines and workflow, then give a fixed-price proposal with a timeline, rather than guessing before we have understood the plant.