In this guide
At six in the morning a line of farmers waits at the collection centre with cans of milk. Each one is weighed, tested and written into a register, and ten days later each one asks why the payment is not what they expected. Most disputes in a dairy cooperative are not about cheating. They are about numbers that nobody can easily show. This guide explains dairy milk collection software and exactly how FAT and SNF pricing works.
What happens at a milk collection centre every morning?
The routine is the same everywhere, and every step creates a number that matters later.
- The farmer arrives with milk and is identified. A farmer code or card links the delivery to the right account.
- The milk is weighed or measured. The quantity is recorded in litres or kilograms.
- A sample is tested. A milk analyser or manual test gives the fat and SNF readings.
- The rate is looked up. The reading is matched against the rate chart.
- A slip is printed or sent. The farmer sees quantity, quality and amount on the spot.
- The milk goes into chilling. It is cooled quickly and held until the tanker arrives.
On paper, that means a register entry and sometimes a handwritten slip. By the time the monthly or ten-day statement is calculated, a single misread digit can change a farmer's pay, and finding it means turning pages.
What do FAT and SNF mean?
FAT is the percentage of butterfat in the milk. It is what makes milk creamy and what is used to make butter and ghee. SNF stands for solids-not-fat: the protein, lactose and minerals left once the water and fat are removed. Together they describe how much useful material a litre of milk contains.
Two farmers may each deliver 10 litres, but if one lot has higher fat and SNF, it yields more product at the plant, so it is usually priced higher. That is why quality is tested at every delivery rather than assumed.
Check your own formula
Cooperatives and private dairies use different pricing methods, and they change over time. Some use a FAT and SNF rate grid, others price per kilogram of fat and SNF, and many add incentives or deductions. Use this article to understand the idea, then follow your own union's or buyer's current rules.
How is the price per litre worked out from FAT and SNF?
The most common method is a rate chart: a grid with FAT along one side and SNF along the other, and a price per litre where the two meet. The invented example below shows the idea only. These are not real procurement prices.
| FAT % | SNF 8.0 (₹ per litre) | SNF 8.5 (₹ per litre) | SNF 9.0 (₹ per litre) |
|---|---|---|---|
| 3.5 | 30.00 | 31.00 | 32.00 |
| 4.0 | 33.00 | 34.00 | 35.00 |
| 4.5 | 36.00 | 37.00 | 38.00 |
| 5.0 | 39.00 | 40.00 | 41.00 |
A worked slip: a farmer delivers 12.5 litres tested at FAT 4.0 and SNF 8.5. The grid gives ₹34.00 per litre, so the amount is 12.5 multiplied by 34, which is ₹425.00. The slip should show all four numbers, so the farmer can check the arithmetic in seconds.
Notice that moving one cell in the grid changes the pay of every farmer at that quality. That is why rate chart edits should be deliberate, visible and recorded with an effective date.
Why do payment disputes happen, and how does transparency end them?
Most disputes come from three places. The farmer remembers a different quantity than the register shows. The quality readings were noted but the farmer never saw them. Or the ten-day total included deductions the farmer forgot, such as a feed advance.
The cure is showing the numbers at the moment they are created. A printed or digital slip per delivery, and a passbook per farmer that lists every delivery, advance and deduction, remove most arguments before they begin. When a dispute does arise, the passbook is the evidence, and you can settle it in a minute rather than a morning.
How do ten-day payments, advances and loans fit together?
Many dairies pay farmers in cycles of about ten days. At the end of a cycle the system adds all deliveries, subtracts recoveries, and produces a payment list. A simple illustration with invented figures: 120 litres delivered across the cycle at an average ₹34 per litre gives ₹4,080. If ₹600 of feed was taken on credit and is recovered in this cycle, the payment is ₹3,480.
The software's job is to apply each recovery in the right order and show the farmer the working. It also needs to produce a bank payment file in the format your bank accepts, so the accounts team is not retyping 150 account numbers. Loans and advances carry a balance and a repayment schedule, so recoveries stop when the balance reaches zero, not a cycle later.
If your cooperative also tracks its own income and costs, our guide on tracking income, expenses and assets explains a simple structure, and how MSMEs reduce costs through digital tools shows the wider picture.
Where do you lose milk between the farm and the plant?
Two things go wrong after collection: quality and quantity.
Quality drops when milk sits warm. A bulk milk cooler (BMC) chills the milk, and a temperature record shows it stayed within the limit your buyer expects. A gauge or alert that shows tank temperature and fill level helps staff react before milk spoils.
Quantity goes missing between the centre and the plant. A tanker collects from several centres, and what the plant receives is compared with what the centres recorded. A difference is a shortfall. Small, consistent differences might be evaporation and measuring variation, but a large or growing one needs investigation: a leaking valve, a dishonest driver or a faulty meter. Without a record of both ends, shortfall becomes a quarrel, not a figure.
Route planning matters too. A tanker visiting four centres can take several routes, and a shorter loop saves fuel and keeps the milk cooler.
Paper register, spreadsheet or dairy software?
| Need | Paper register | Spreadsheet | Dairy software |
|---|---|---|---|
| Record a delivery | Handwritten line | Typed after the shift | Weighing console with slip preview |
| Look up the rate | Printed chart | Lookup formula | Rate chart applied automatically |
| Farmer statement | Hand total | Pivot per farmer | Passbook per farmer |
| Ten-day payment | Calculator, hours of work | Formulas, easy to break | Batch with deductions and bank file |
| Spot shortfall | Not visible | Possible with effort | Centre versus plant receipt comparison |
| Quality trends | None | Manual charts | Quality lab and analytics views |
How do you roll out collection software at a centre?
- Register farmers and codes. Clean names, codes and bank details before anything else.
- Enter the current rate chart. Check it cell by cell against the paper chart.
- Run both systems in parallel for a few cycles. Compare slips and totals daily.
- Add advances and the payment batch. Verify one cycle before paying from it.
- Add chilling and dispatch records. Start recording both centre and plant numbers.
- Introduce analytics last. Quality and volume trends are meaningful only after some history.
What should you ask a dairy software vendor?
- Can it connect to the milk analyser and weighing scale I already use, or does a person type the readings?
- Can I edit the rate chart, with an effective date and a history of changes?
- What does the farmer see: a printed slip, an SMS, an app or all three?
- Does it work offline at a centre with poor signal and sync later?
- Can it produce my bank's payment file?
- Can I export every farmer's history, and who owns the data?
- What is pricing and is hosting billed separately?
Mistakes to avoid
- Changing the rate chart without notice. Farmers notice, and trust drops faster than it builds.
- Letting a typed reading replace a measured one. If staff can override the analyser, errors and favours creep in.
- Ignoring offline. A system that stops when signal drops will be abandoned in a week.
- Trusting AI alerts blindly. An anomaly flag is a reason to retest, not a verdict.
What the DairyOcta demo shows
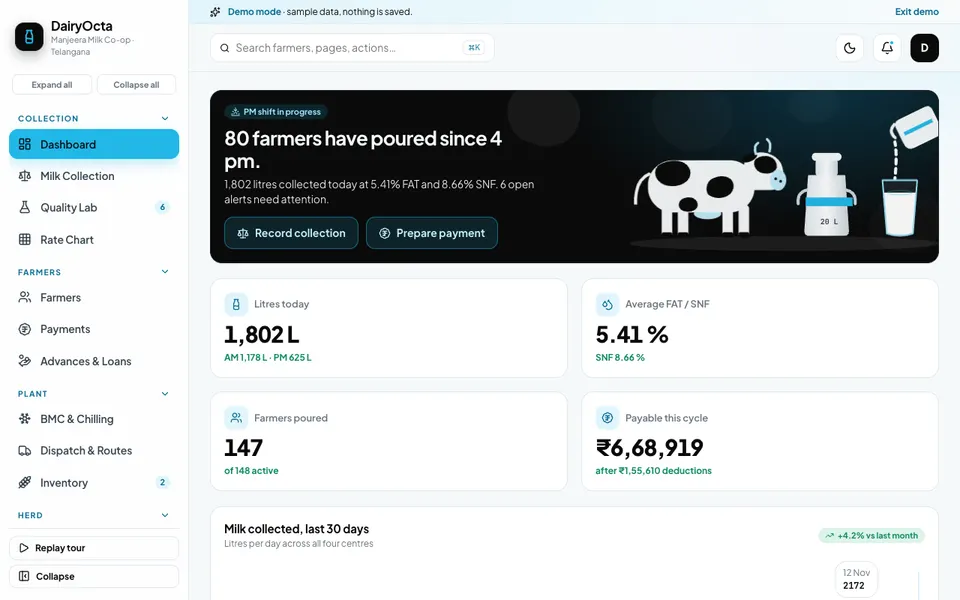
DairyOcta is an interactive Zenocta demo of milk collection and dairy cooperative management. It uses synthetic Telangana and Andhra data. Nothing is saved, the data resets on refresh, and its AI tools are scripted rules rather than real models. It is a demonstration of what a custom system could do, not a product with customers.
- Dashboard and Milk Collection. A weighing console with slip preview.
- Quality Lab and Rate Chart. The rate chart is an editable FAT by SNF heat map, so you can see how one change colours the grid.
- Farmers, Payments, Advances and Loans. A profile drawer with passbook, ten-day batches and a bank file.
- BMC and Chilling. An animated tank and a temperature gauge.
- Dispatch and Routes. An SVG village map, plant receipts and shortfall.
- Inventory. Feed on credit.
- Cattle and Breeding. Records, an AI, pregnancy and calving calendar, vet visits and vaccines.
- Analytics and Dairy Studio (simulated). Analytics has four tabs. Studio includes an adulteration and anomaly detector, yield predictor, cattle health alert, rate chart optimiser, tanker route optimiser, voice entry in English, Hindi and Telugu, and a payment dispute assistant with a WhatsApp preview.
The maps are stylised and not real geography, voice is scripted without a speech service, and printing is a preview only.
How to try the DairyOcta demo
- Open dairyocta.zenocta.com.
- On the login screen, choose Try Demo Account.
- Open Rate Chart and edit a FAT by SNF cell, then open Milk Collection to see a slip.
- Open a farmer's passbook, then Payments to view a ten-day batch.
- Open BMC and Chilling, then Dispatch and Routes. Refresh to reset.
Other industries are on the demo apps page.
Having a collection system built for your cooperative
Every dairy has its own rate formula, centres, payment cycle and bank format. That is why off-the-shelf tools often need workarounds. Zenocta builds custom software around your rules, starting with a conversation about how your centres run now and then a scoped, fixed-price proposal. If you are considering it, talk to us about a custom build, or see the finished apps on Google Play.
Shops that sell dairy products might also like our guide on billing and inventory for retail shops.
Try it live
Open the real thing: demos run in a new tab with sample data, apps link to their own page.
 Live demoDairyOcta live demoOpen a sample cooperative: weighing console, editable FAT by SNF rate chart, passbooks, chilling and tanker routes.
- ABrowse allAll demo appsBrowse every interactive demo, each with a sample company and nothing saved.
- ZBrowse allZenocta appsProduction apps live on Google Play.
- TBrowse allTalk about a custom buildTell us how your business runs and get a scoped, fixed-price proposal.
Frequently asked questions
01What do FAT and SNF mean in milk?
FAT is the percentage of butterfat in milk. SNF means solids-not-fat: the protein, lactose and minerals that remain after water and fat are removed. Both are measured at collection and used to price the milk.
02How is the price of milk worked out from FAT and SNF?
Many dairies use a rate chart that gives a price per litre where a FAT value meets an SNF value. Others price per kilogram of fat and SNF. Methods differ by union and buyer, so follow your own current formula.
03What should dairy milk collection software include?
A weighing and testing console that prints or sends a slip, an editable rate chart, farmer accounts with a passbook, ten-day payment batches with advances, chilling records, tanker dispatch with shortfall, and reports on quality and volume.
04Is DairyOcta a real product with real farmers?
No. DairyOcta is an interactive demo using synthetic Telangana and Andhra data. Nothing is saved, data resets on refresh, voice entry is scripted and its AI tools are simulated. It shows what a custom dairy system could contain.
05Can Zenocta build a milk collection system for my cooperative?
Yes. Zenocta builds custom business software. We start with your rate formula, centres, payment cycle and bank format, then provide a scoped, fixed-price proposal for a system built around your rules.