In this guide
A poultry farmer with several sheds, a layer unit and a few ponds is running a dozen small businesses at once, each with its own daily numbers. Feed bags are counted in one notebook, deaths in another, and the buyer's balance in a third. When the batch is lifted and the profit is lower than expected, nobody can say which week it slipped away. This guide explains what poultry farm management software should track, with a clear look at feed conversion and mortality.
Why do poultry farms lose money without noticing?
The margin in a broiler batch is thin enough that small, repeated losses decide the result. They are hard to see because each one is small on the day.
- Feed. Feed is the largest cost. A few extra kilos per shed per day look harmless and add up over a batch.
- Mortality. Deaths are counted every morning, but the running percentage is rarely calculated until the batch ends, when it is too late to act.
- Weight. Without regular sampling, you do not know whether birds are on target until lifting day.
- Selling. The rate on the day, the number of birds lifted and the money collected are written in different places.
- Several sites. An owner with farms in different districts relies on phone calls for a picture that should be a dashboard.
Software does not make birds grow faster. It makes small losses visible while there is still time to ask why.
How do you measure FCR and mortality?
What is FCR?
FCR stands for feed conversion ratio: how many kilograms of feed the flock ate for each kilogram of live weight it produced. A lower number means less feed per kilogram of bird. Here is a made-up batch with invented numbers.
| Item | Figure |
|---|---|
| Chicks placed | 5,000 |
| Deaths during the batch | 250 |
| Birds lifted | 4,750 |
| Average lifting weight | 2.0 kg |
| Total feed consumed | 16,000 kg |
Total live weight is 4,750 birds multiplied by 2.0 kg, which is 9,500 kg. FCR is 16,000 divided by 9,500, which is about 1.68. This simple version ignores the weight of the day-old chicks, and some farms subtract it, so decide on one method and use it every time. What matters is the trend: the same method applied to every batch and every shed.
How do you track mortality?
Mortality percentage is deaths divided by chicks placed. In the example, 250 divided by 5,000 is 5%. The useful habit is to record deaths daily and let the system keep the running total by shed and batch, so a shed that is drifting away from the others shows up in days. Deaths are also information for your veterinarian: bring the record, not a guess. This guide is about record keeping and gives no animal health advice, so follow your vet's guidance for any decision about the flock.
Tip
Record the daily numbers at the shed, on a phone, the same morning. A figure remembered until evening is a figure that gets rounded.
What else does the farm need to record?
Layers and eggs
For layers, the key measure is how many of your hens produced an egg that day. Hen-day production is eggs collected divided by hens alive, times 100. With an invented 3,420 eggs from 4,000 hens, the figure is 85.5%. Add breakages, grading and what was sold, and you can see the real yield per shed.
Ponds and aquaculture
Fish and prawn ponds follow the same logic of stocking, feeding, sampling and harvest, with water readings as extra data. Keeping each pond as its own batch means feed cost and output are comparable between ponds, instead of being averaged away.
Vaccination and schedules
A vaccination calendar is a scheduling record: what is due, for which shed, on which day, and whether it was done. Software can remind the farm team and keep the history, but the schedule itself comes from your veterinarian and the product label, never from the software.
Expenses and profit
Feed, chicks, medicines, labour, power and transport should each be entered against a batch, so profit is known per batch and not just per year. A batch that looked profitable on sales may look different once all the costs are on it.
How do you manage buyers, rates and weigh slips?
Selling is where a good batch can still go wrong. The rate moves daily, buyers lift on different days, and payment is often late. A tidy process records four things for every lifting: the buyer, the rate agreed, the weight on the weigh slip, and the money received.
A made-up example: a buyer lifts 1,850 kg at an agreed rate of ₹95 per kg. The amount is 1,850 multiplied by 95, which is ₹1,75,750. If the buyer pays ₹1,00,000 on the day, ₹75,750 is outstanding. Without a record, that balance lives in someone's memory. With one, it appears on an outstanding list, and a reminder message can go out the same evening.
The same thinking applies in other agricultural trades: see our guide to dairy milk collection software for how quality and rate drive the payment, and our guide to farm and FPO management software for crop-side records.
How do you roll out farm software without slowing the sheds?
- Start with one shed and one batch. Prove the daily routine before you spread it.
- Set up sheds, ponds and batches. Include placement date, number of birds and the target weight curve you already use.
- Collect the five daily numbers. Feed, deaths, eggs where relevant, weight samples and climate readings if you track them.
- Review the dashboard together every morning for a week. Let the shed supervisors see their own numbers.
- Add selling and money. Rates, lifting, weigh slips and outstanding balances.
- Add the second farm. By now the routine is proven, and the owner can compare sites.
What should you ask a vendor, and what goes wrong?
Questions to ask
- Is the data entered per shed and per batch, with FCR and mortality calculated automatically?
- Can I define my own method for FCR (for example, whether chick weight is subtracted) and keep it consistent?
- Does it work on a basic phone and tolerate weak signal in the shed?
- Can a supervisor enter data without being able to change a past batch?
- Does it handle buyers, rates, weigh slips and outstanding balances, not just production?
- Can I see all my farms on one screen, and export everything to a spreadsheet?
- Can the vaccination calendar be edited to follow my vet's schedule?
Common mistakes
- Measuring too late. A number reviewed only at the end of a batch cannot change that batch.
- Mixing methods. If FCR is calculated three ways, the trend means nothing.
- Entering data once a week. Weekly entry produces guesses. Daily entry takes a minute.
- Ignoring selling. Profit leaks at the buyer's end as often as in the shed.
Notebook, spreadsheet or purpose-built software?
| Approach | Works when | Breaks when |
|---|---|---|
| Notebook per shed | One small shed run by the owner | Several sheds or farms must be compared, or totals are needed mid-batch |
| Spreadsheet | One careful person enters and checks every number | Entry is delayed, formulas are changed, or supervisors on phones cannot update it |
| Purpose-built farm software | Daily records, calculations and buyer balances must agree | It is too complex for the people entering the numbers |
If you run a single small unit, a good notebook and a simple sheet may be enough. The case for software grows with the number of sheds and sites. For a wider view of cutting waste through simple digital tools, see how MSMEs can reduce costs through digital transformation.
What the PoultryOcta demo shows
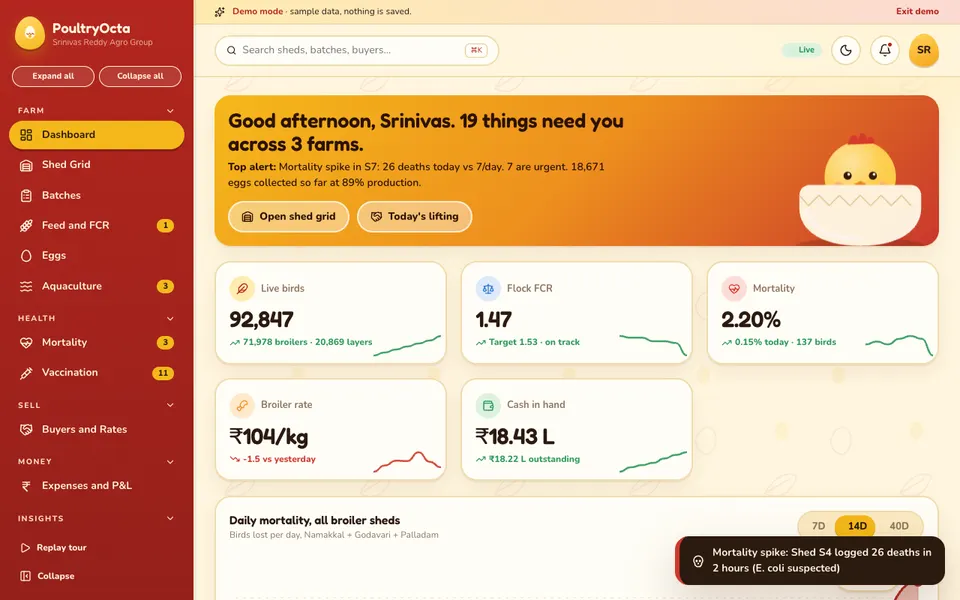
PoultryOcta is an interactive demo for poultry and aquaculture farms. It follows a made-up owner with three farms. All data is sample data, sign-in is not real, nothing you do is saved, and everything resets on refresh. The seven tabs in Farm Studio that look like AI are deterministic demos, not real models, and none of them is veterinary advice.
The demo has 14 routes. The main ones are:
- Dashboard: the farm owner's overview across all three farms.
- Shed Grid: the signature screen, with per-batch health dials for mortality, FCR, weight against target and climate. Click a shed for detail.
- Batches, and Feed and FCR: batch records and feed consumption with the FCR calculation.
- Eggs, and Aquaculture: layer production and pond records.
- Mortality, and Vaccination: daily deaths, and a drag-and-drop vaccination calendar that records withdrawal.
- Buyers and Rates: a rate board, a lifting kanban, weigh slips, outstanding balances and a prepared WhatsApp message.
- Expenses and P&L, and Reports: cost entry, profit and loss, and CSV export.
- Team and Settings: the people and configuration. The login offers phone OTP, email, SSO and Google, with four roles.
- Farm Studio (simulated): a disease detector, harvest predictor, feed optimiser, mortality early warning, best selling day, water-quality advisor and voice daily entry in Telugu, Hindi and English.
The demo also has a guided tour, a Ctrl or Cmd + K command palette, live farm events, a light and dark switch, and a drawer plus bottom navigation on tablet and phone.
How to try it
Open the demo and choose Try Demo Account on the login screen. Start at the Shed Grid, click a shed to see its dials, then open Buyers and Rates and look at the lifting kanban. The demo apps page lists many other samples.
How do you get farm software built around your sheds?
Every farm counts differently: its own batch cycle, its own feed schedule, its own buyers. A short conversation about your sheds, ponds, daily numbers and selling process is the right first step. From that we can prepare a scoped, fixed-price proposal for a custom build that follows your method, not a generic one. When you are ready, talk to us about a custom build, or see what we have published on the apps page.
Try it live
Open the real thing: demos run in a new tab with sample data, apps link to their own page.
 Live demoPoultryOcta live demoOpen the Shed Grid health dials, the vaccination calendar and the buyers lifting kanban, with sample data.
- ABrowse allAll demo appsBrowse every interactive industry demo with sample data.
- ZBrowse allZenocta appsProduction apps live on Google Play.
- TBrowse allTalk about a custom buildDescribe your sheds and daily numbers and get a scoped, fixed-price proposal.
Frequently asked questions
01What does poultry farm management software track?
It tracks batches, daily feed, mortality, weight samples, eggs, ponds, vaccination schedules, expenses, and buyers with rates, weigh slips and outstanding balances, then calculates figures such as FCR and mortality percentage by shed and batch.
02How is FCR calculated?
Divide total feed consumed by total live weight produced. In a made-up example, 16,000 kg of feed and 9,500 kg of live weight give an FCR of about 1.68. Some farms subtract chick weight, so choose one method and keep it.
03Can software give veterinary or biosecurity advice?
No. Software records numbers and schedules, but animal health decisions belong to your veterinarian and the product label. Use the records to give your vet a clear history, and keep any vaccination schedule aligned with their guidance.
04Is the PoultryOcta demo a working farm system with real data?
No. It is an interactive demo with sample data for a made-up three-farm owner. Nothing is saved, it resets on refresh, and the Farm Studio tools are simulated demos rather than real models or veterinary advice.
05How do I get farm management software built for my farm?
Start with a short conversation about your sheds, ponds, daily numbers and selling process. Zenocta then prepares a scoped, fixed-price proposal for a custom build that follows your method. Use the contact page to begin.